making waves with ugc:
How Increasing UGC Sparked Major Growth for Splashes in November
Background
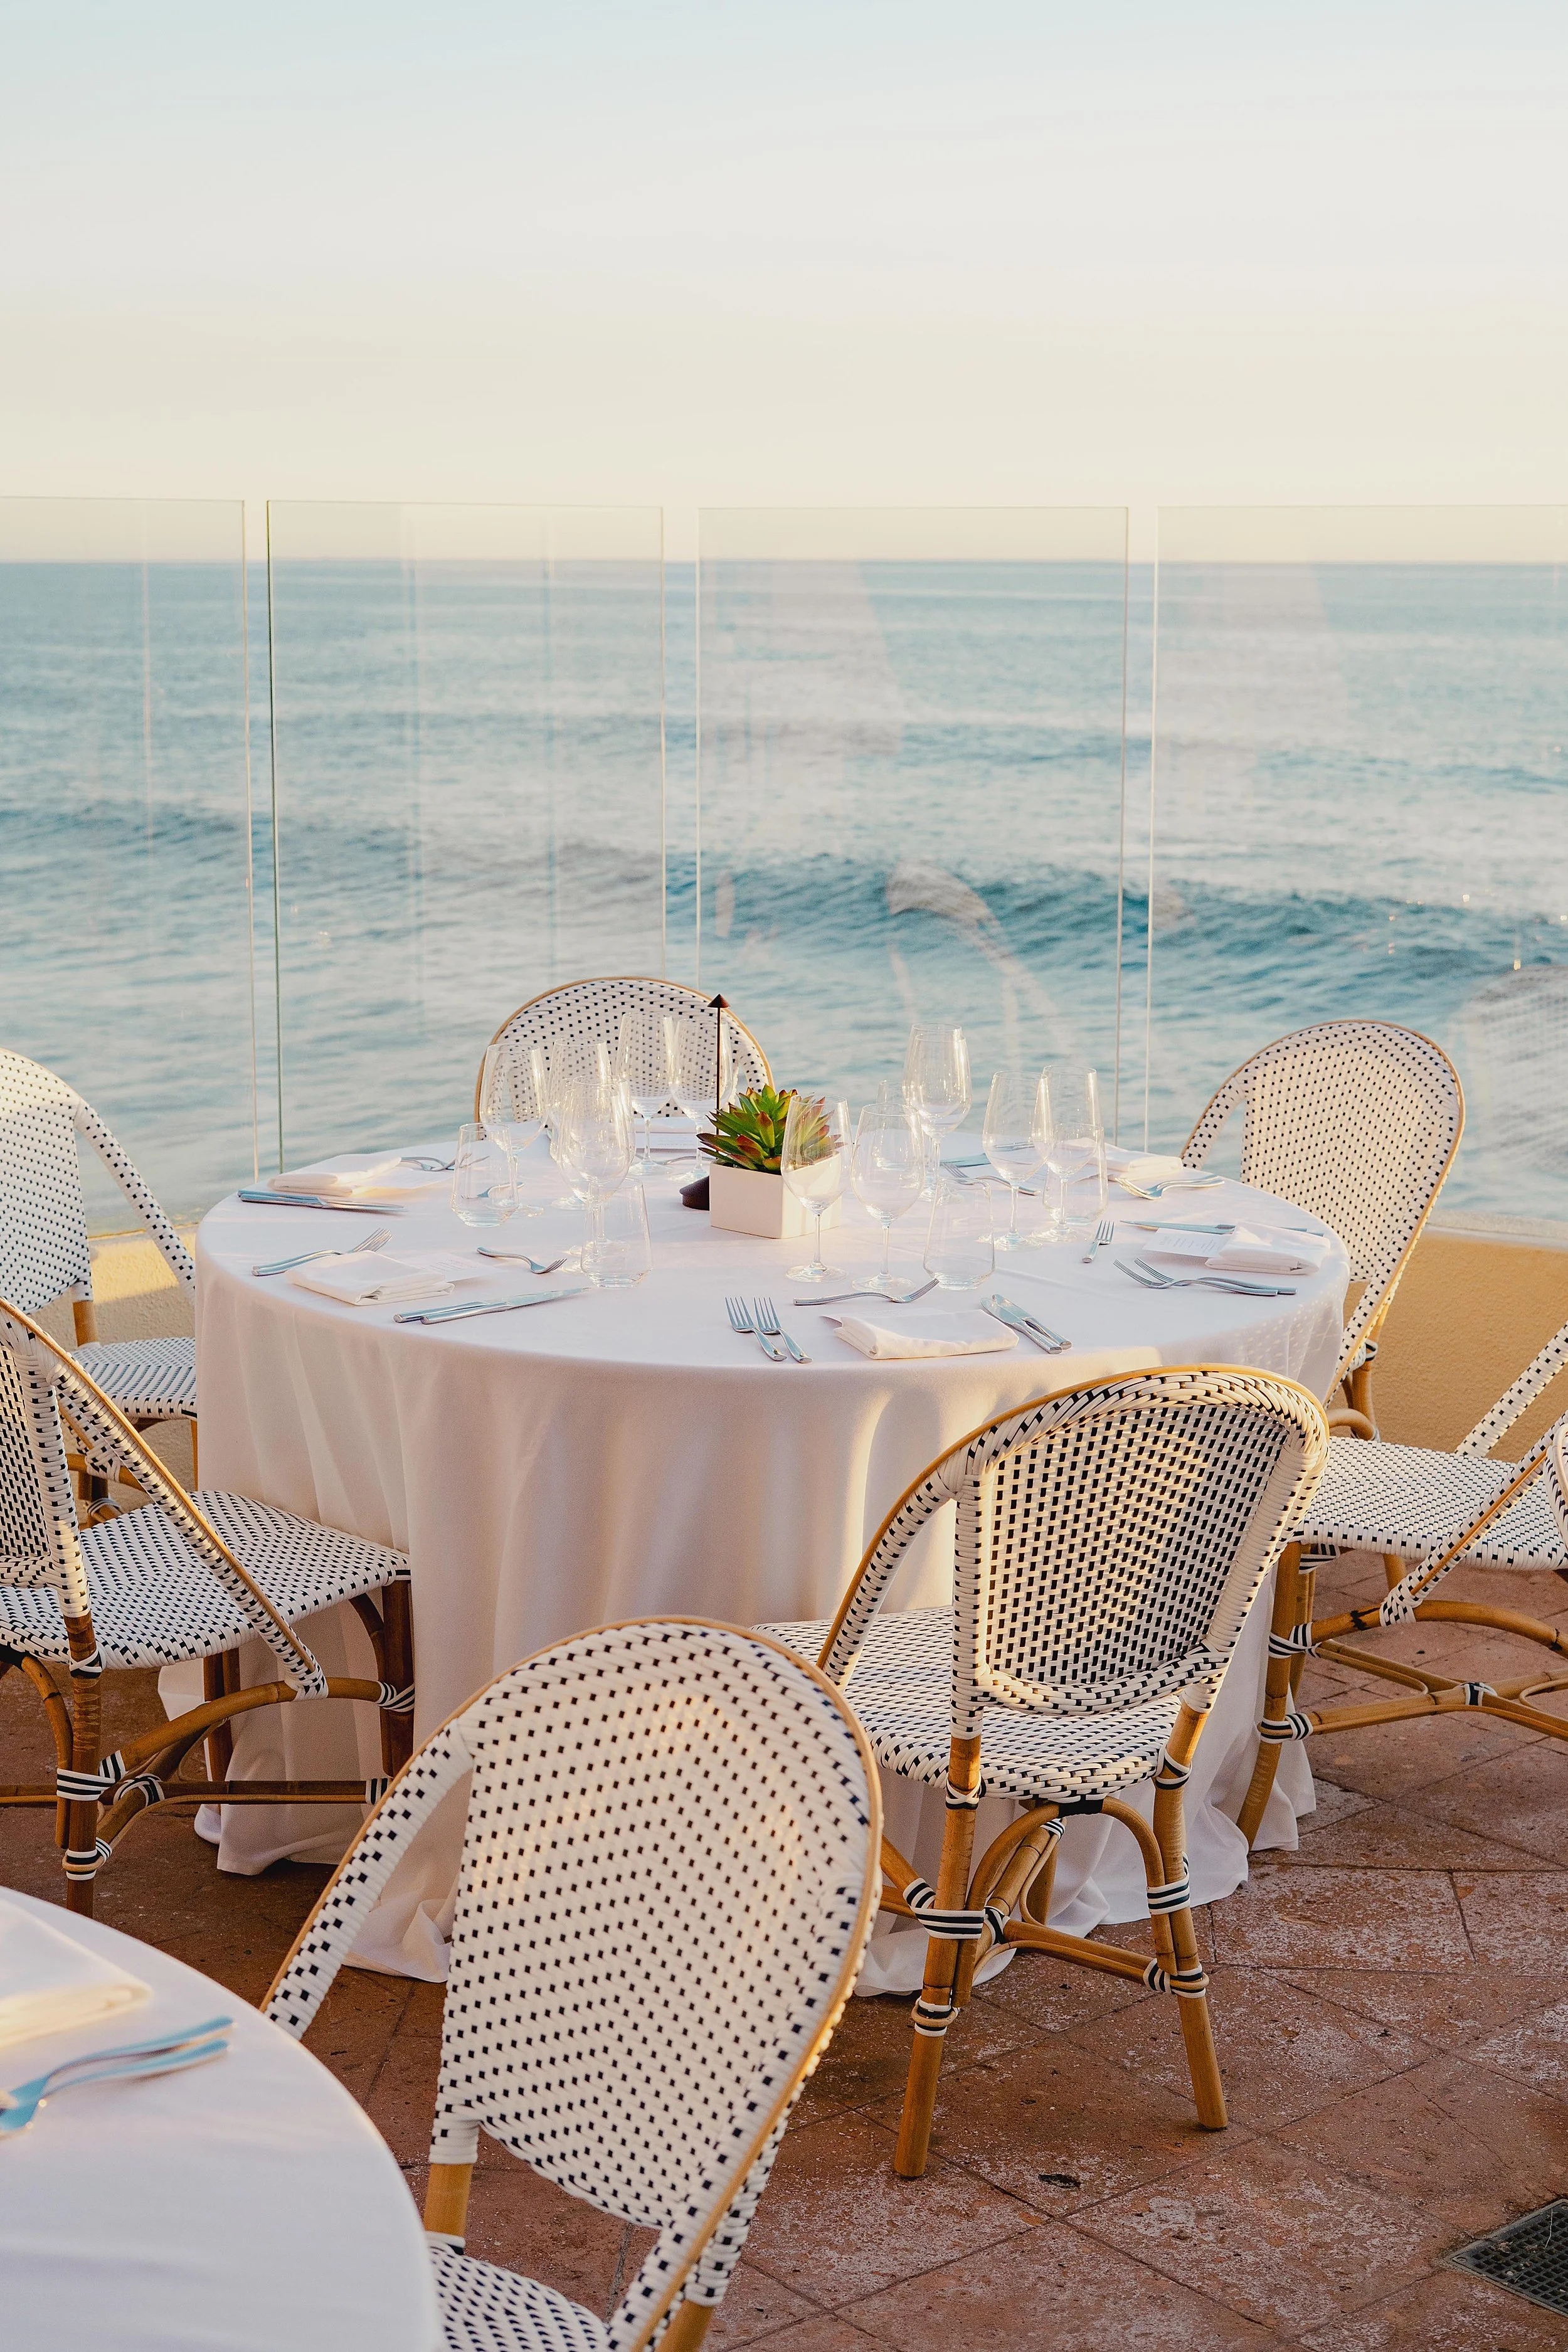
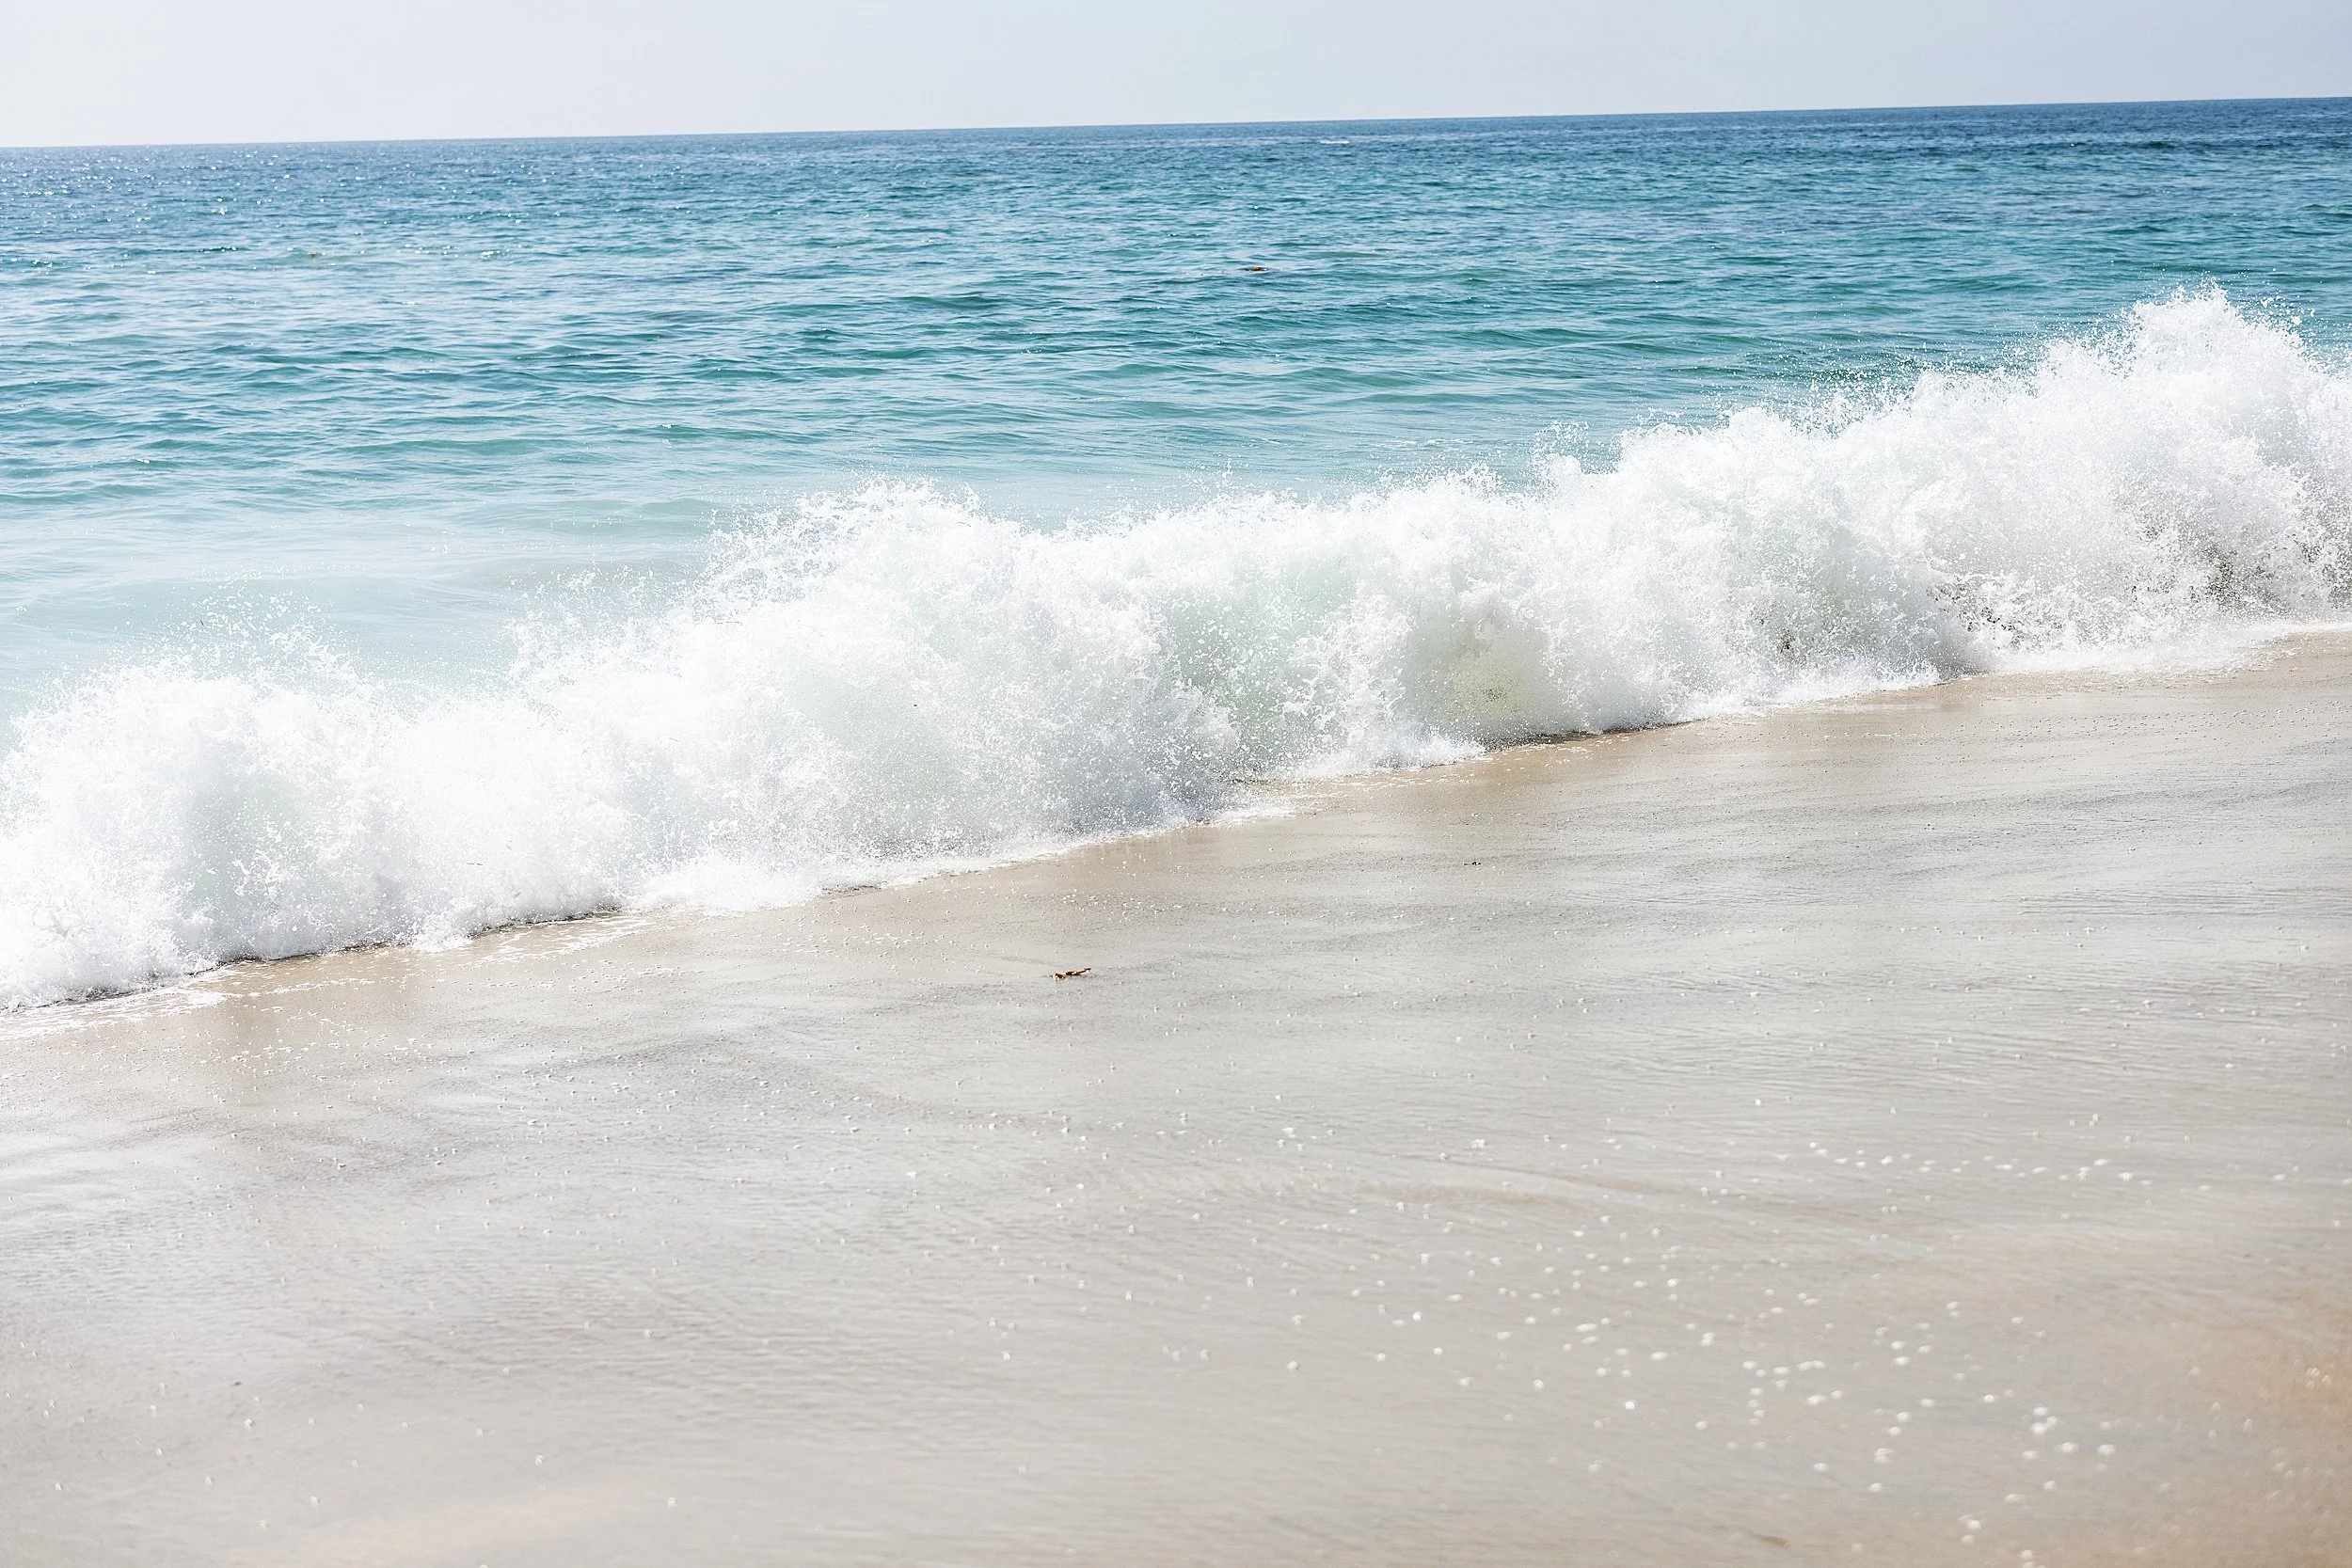
In November, we intentionally increased the usage of UGC-style content for Splashes Restaurant, leaning into beach POVs, guest-shot clips, and natural, in-the-moment visuals. This shift toward more relatable, human-first storytelling created a noticeable lift across reach, engagement, and follower acquisition throughout the month.
The results show that UGC not only resonated deeply with the audience but also performed as the primary driver behind several month-over-month increases.
Challenge
Historically, Splashes relied heavily on polished, brand-led content. While beautiful, these assets didn’t always produce the strongest engagement or viral reach.
Our hypothesis going into November:
If we incorporate more authentic UGC and UGC-inspired visuals, we can increase virality, relatability, and saves, leading to stronger organic growth.
how we did it:
To bring more authenticity into Splashes’ November content, we proactively scoured Instagram and TikTok for the strongest guest-captured moments selecting only the UGC that aligned with Splashes’ brand identity and visual standards. After identifying best-in-class creators, we reached out directly to secure explicit permission to repost their content, ensuring every asset was both on-brand and properly cleared.
-
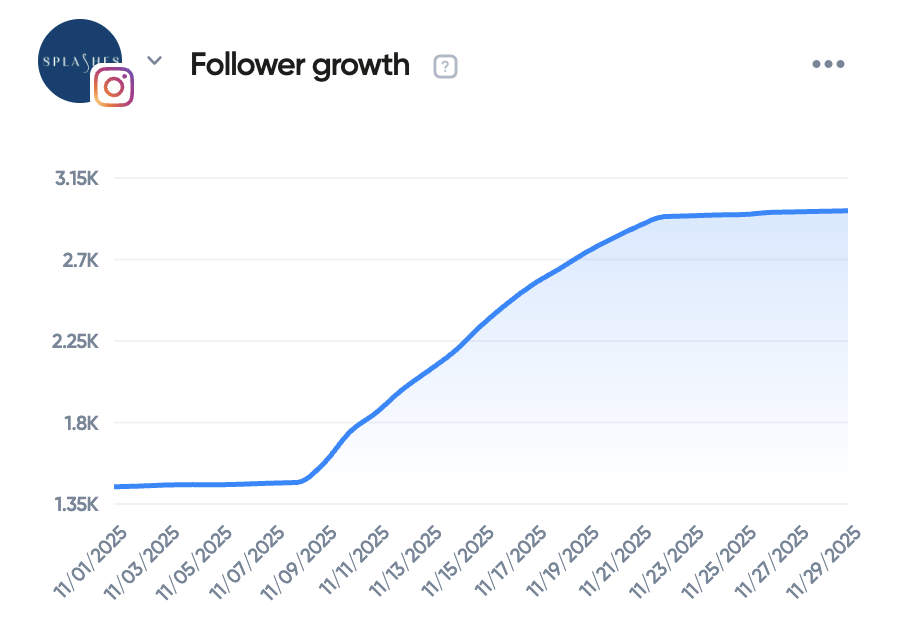
Explosive Follower Growth:
- +1.6K followers gained on Instagram (a +480% surge vs. prior period)
- Follower count increased from approx. 1.4K → 3K
- Growth correlated with the days the highest-performing UGC videos were posted.
-
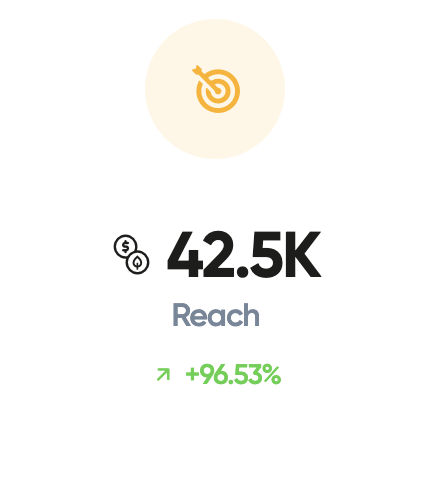
Massive Increases in Reach & Impressions
- 108.2K Reach (+125%)
- 224.5K Total Impressions (+70%)
-
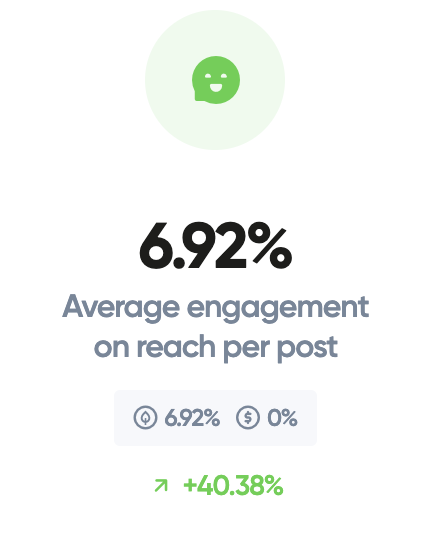
Higher Engagement Rates Across the Board
- Engagement Rate: 2.21% (+9%)
- Engagement on Reach: 6.92% (+40%)
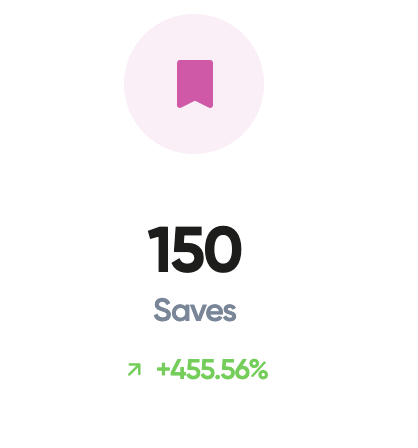
- Shares: +124%
- Saves: +455% (150 total saves)
-
Reels Performance Strengthened
- 8 reels posted
- Reach increased to 5.4K
- 127 saves on reels